The tables above show the changes to the number of students eating school lunches, packed lunches, and going home for lunch between 1999 and 2000.
Summarize the information by selecting and reporting the main features, and make comparisons where relevant.
Write at least 150 words.
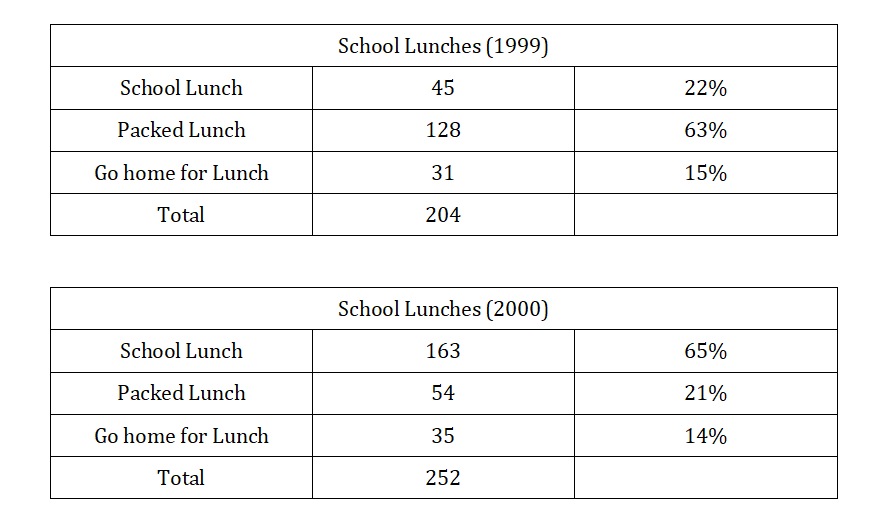
The two tables show data relating to school lunches in the years 1999 and 2000 respectively; more precisely, they reveal the amount of students and percentage of total students partaking in school lunches, packed lunches and going home for lunch in those years.
The first piece of data to acknowledge is that the total number of students changed over the two years: whilst there were 204 students in 1999, the year 2000 saw this number increase to 252. The knock-on effect of this increase is that an increase in the number eating one kind of lunch does not correlate to an equal statistical rise in the percentage (this can be seen in the fact that the number of students going home for lunch increased – from 31 to 35 – but the percentage of the total actually fell from 15% to 14%).
Nevertheless, two large changes in habits are noticeable. Firstly, the number of students who opted to take a school lunch rose dramatically, moving from 22% in 1999 (45 out of the 204 total students) to 65% in 2000 (163 out of 252). This significant increase – up 43% – was offset by a sharp fall in pupils choosing a packed lunch, which decreased by 42%: from 63% in 1999 (128 of 204), the number plunged to 21% in 2000 (54 of 252). Compared to the movement shown in these two categories, that which occurred in the ‘go home for lunch’ group can be labelled as relatively minor.